 | 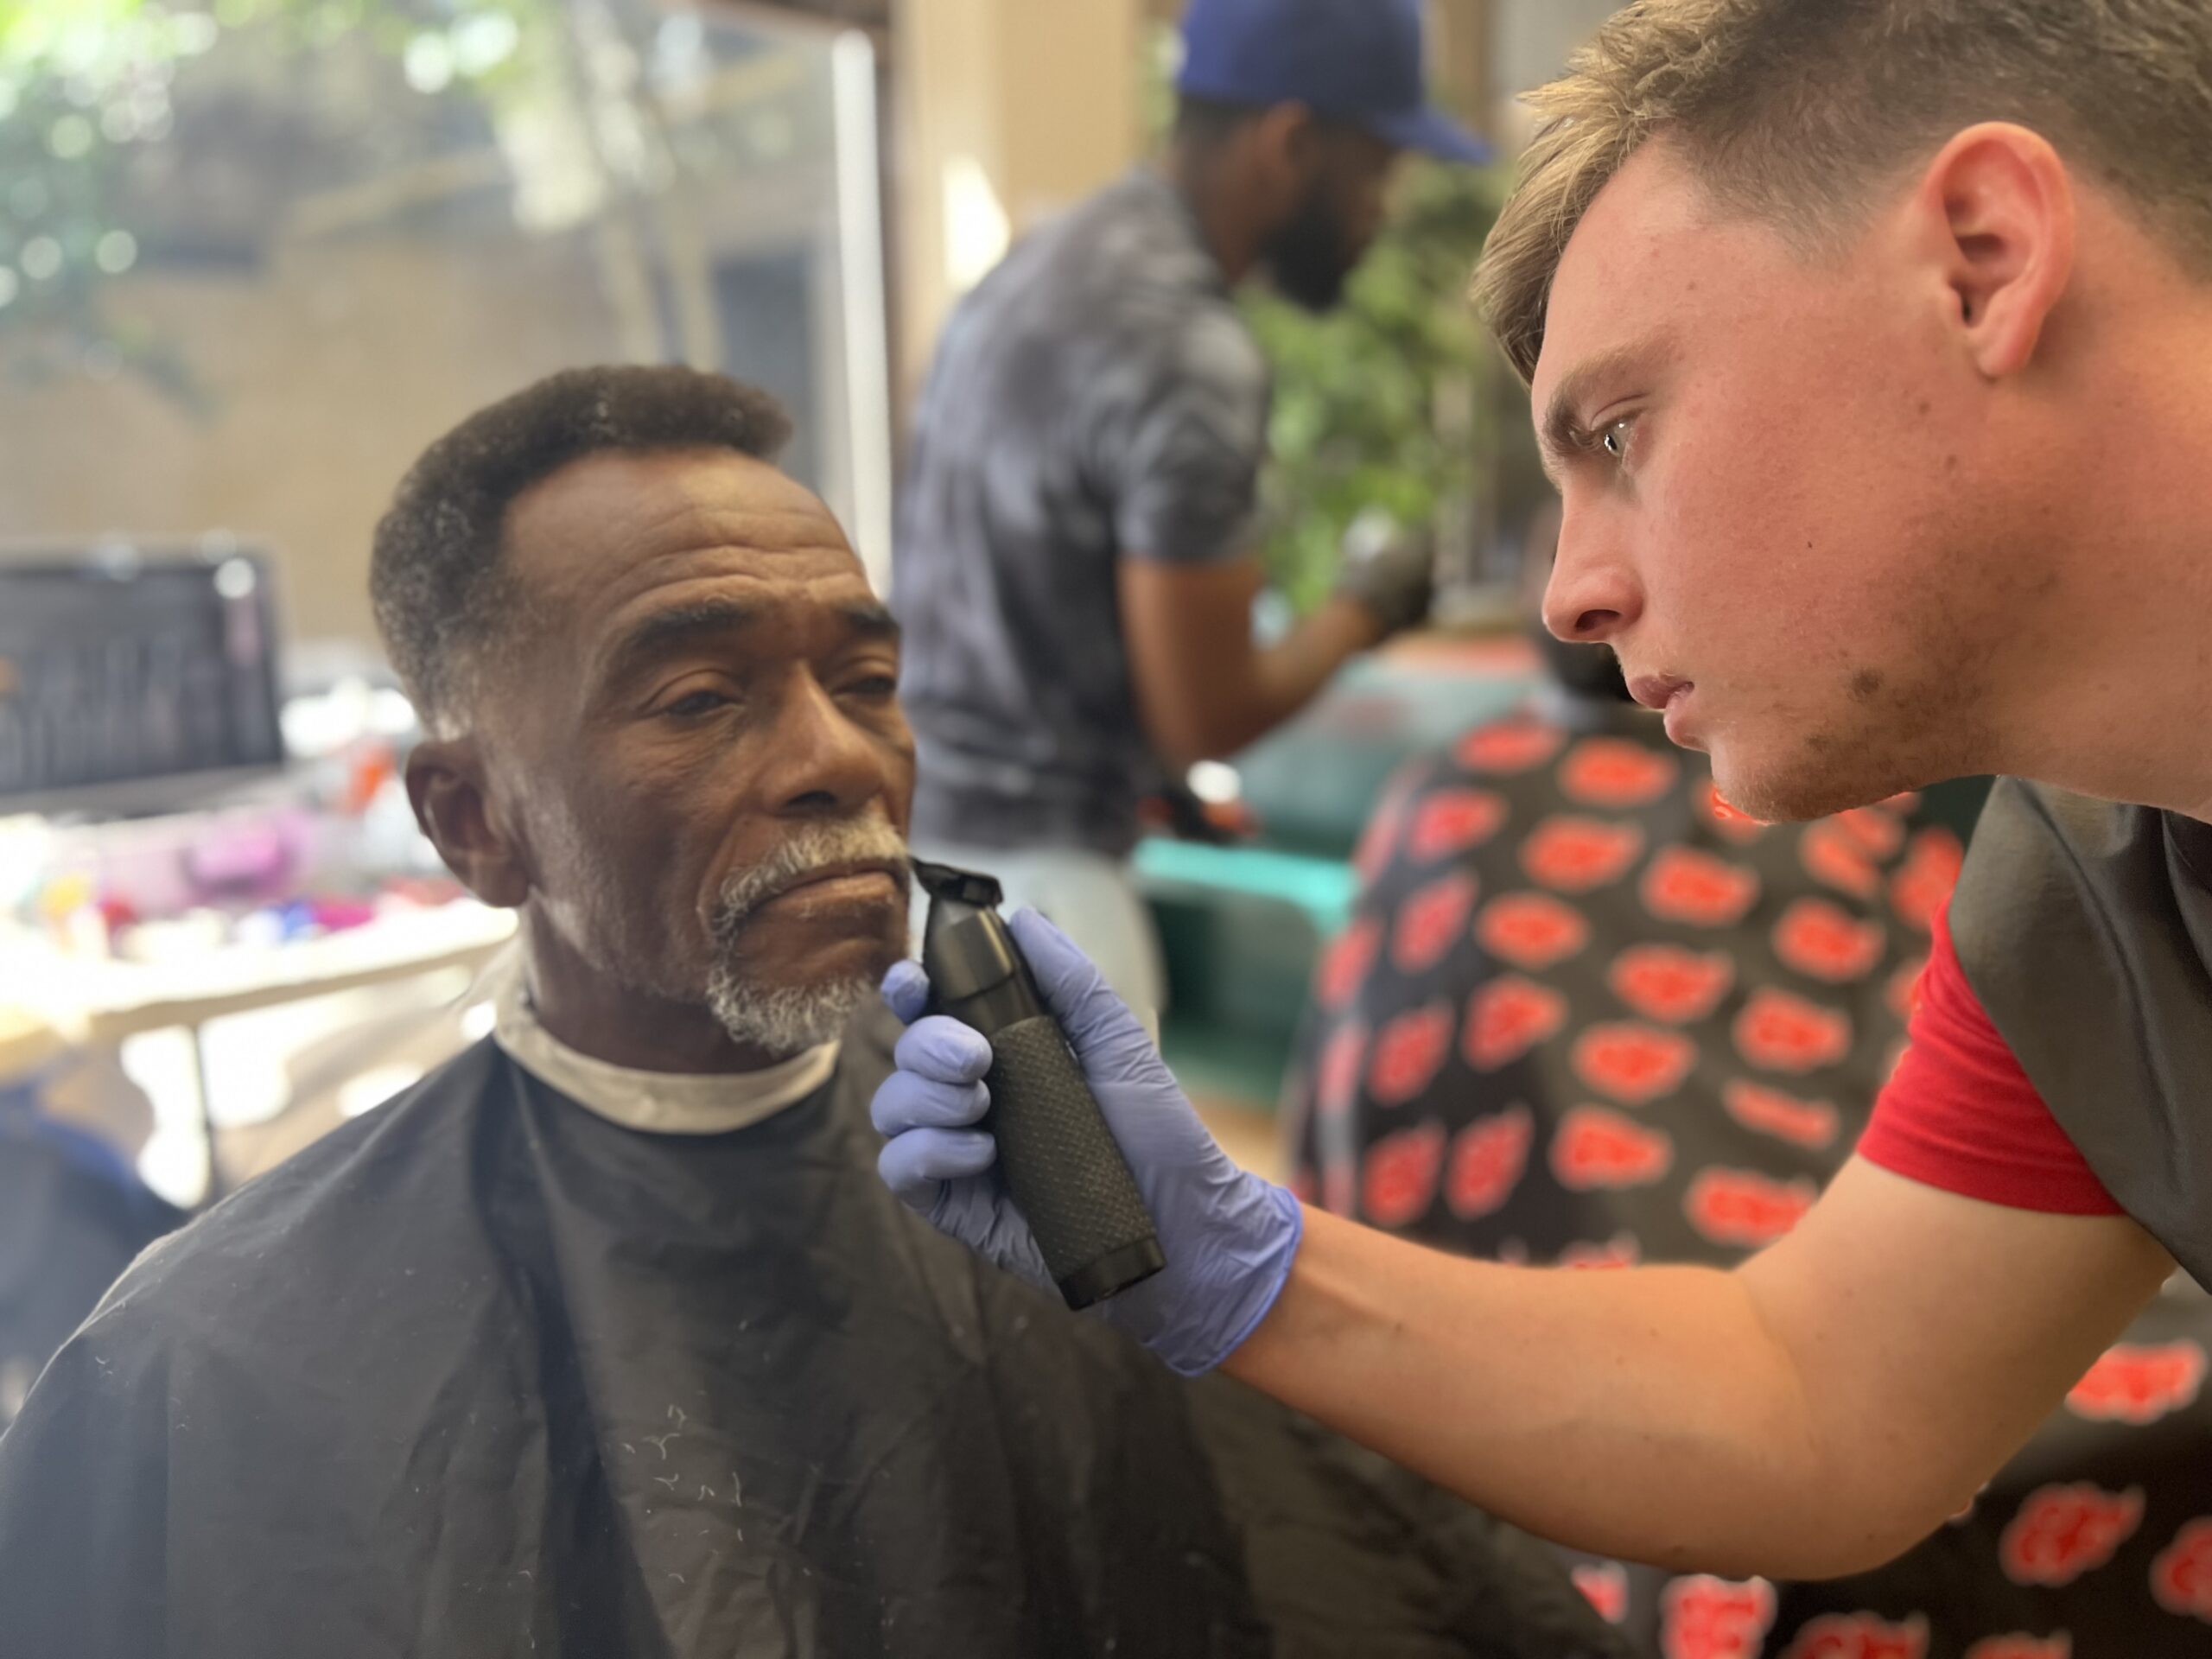 |  |
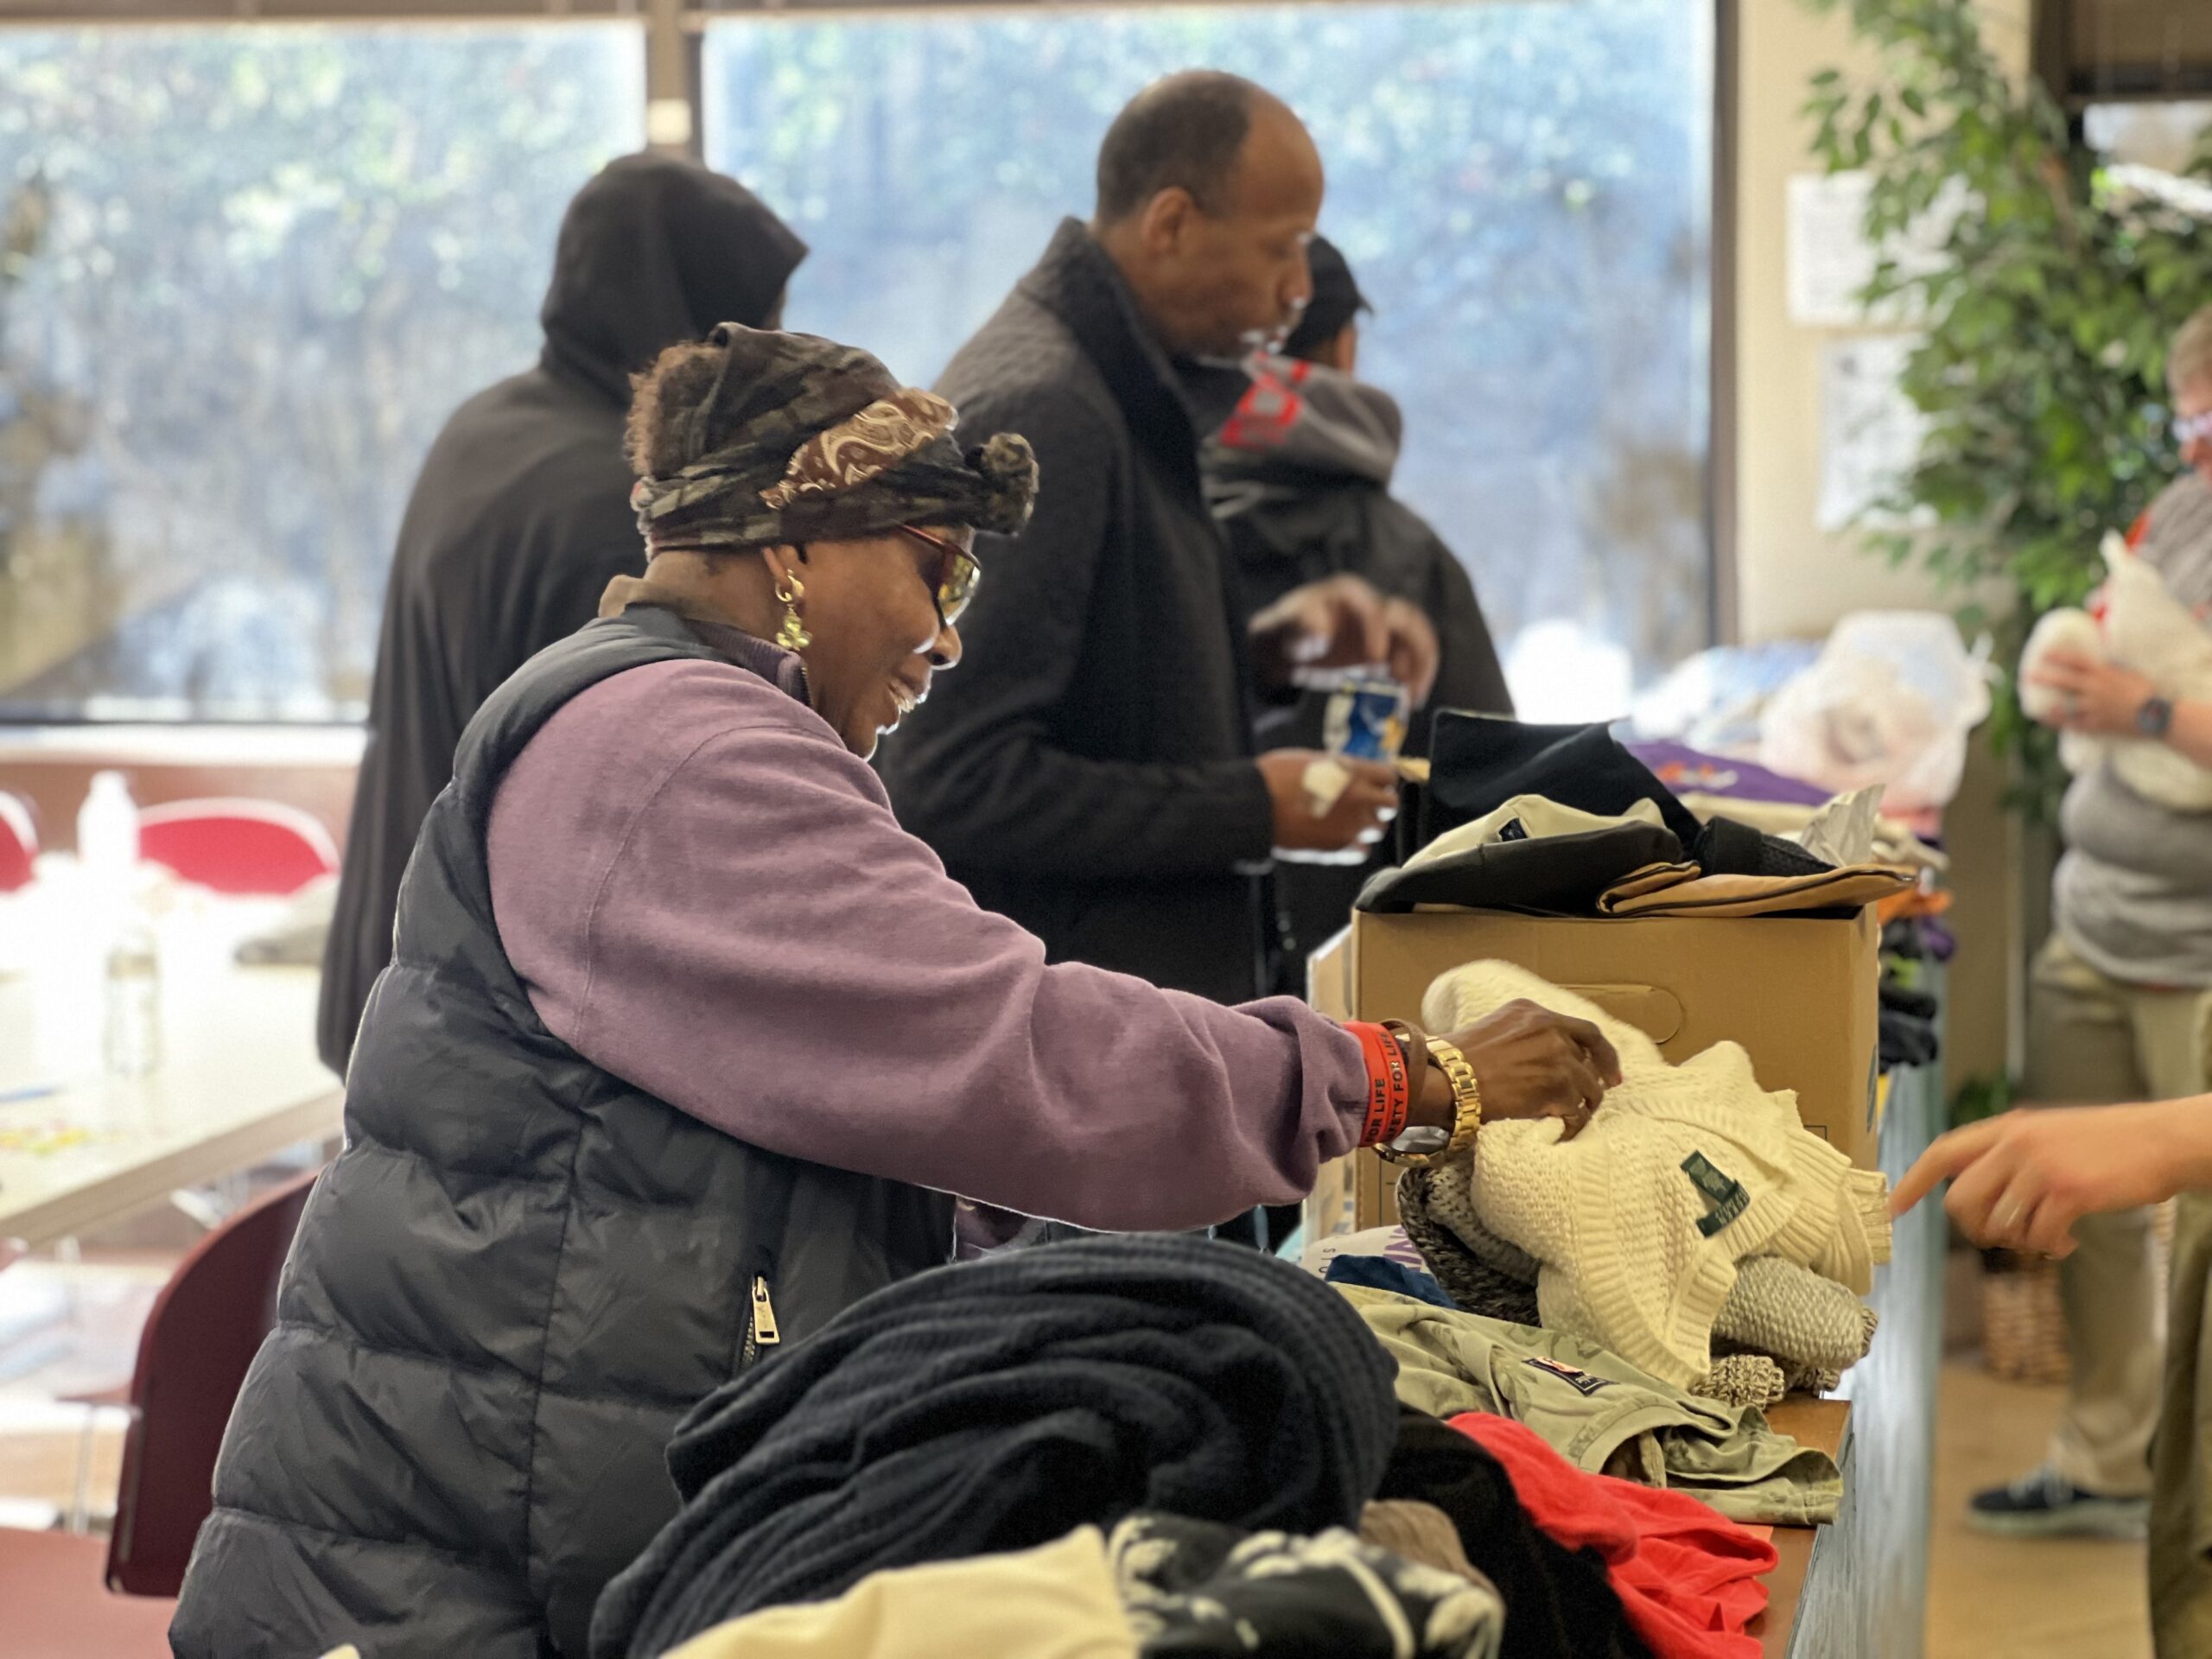
At Central OAC, we serve a variety of individuals on a daily basis. Each person who comes through our doors has a story, and we strive to meet each guest where they are by listening to these important stories. A main lesson our guests continue to teach us is that homelessness and poverty are complicated issues. Each guest experiences a variety of hardships, both societal and individual, that lead to their circumstances. However, our guests also continue to inspire us with their resilience and hope. To give you a taste of who our guests are and what they experience, here are a few demographics from 2023 about the people we serve:
| Average # of Services Provided per Day | 50 |
| Race and Ethnicity | 2999 Black/African American 312 white 243 mixed race or other |
| Gender | 2849 male identifying 681 female identifying 42 transgender or other |
| Age | majority between the ages of 35 and 64 |
| Experiencing Homelessness | 2117 |
| Veterans | 245 |
| ID assistance | 621 assisted with birth certificates 1817 assisted with ID |
| Medical | 1493 assisted with access to medical care |
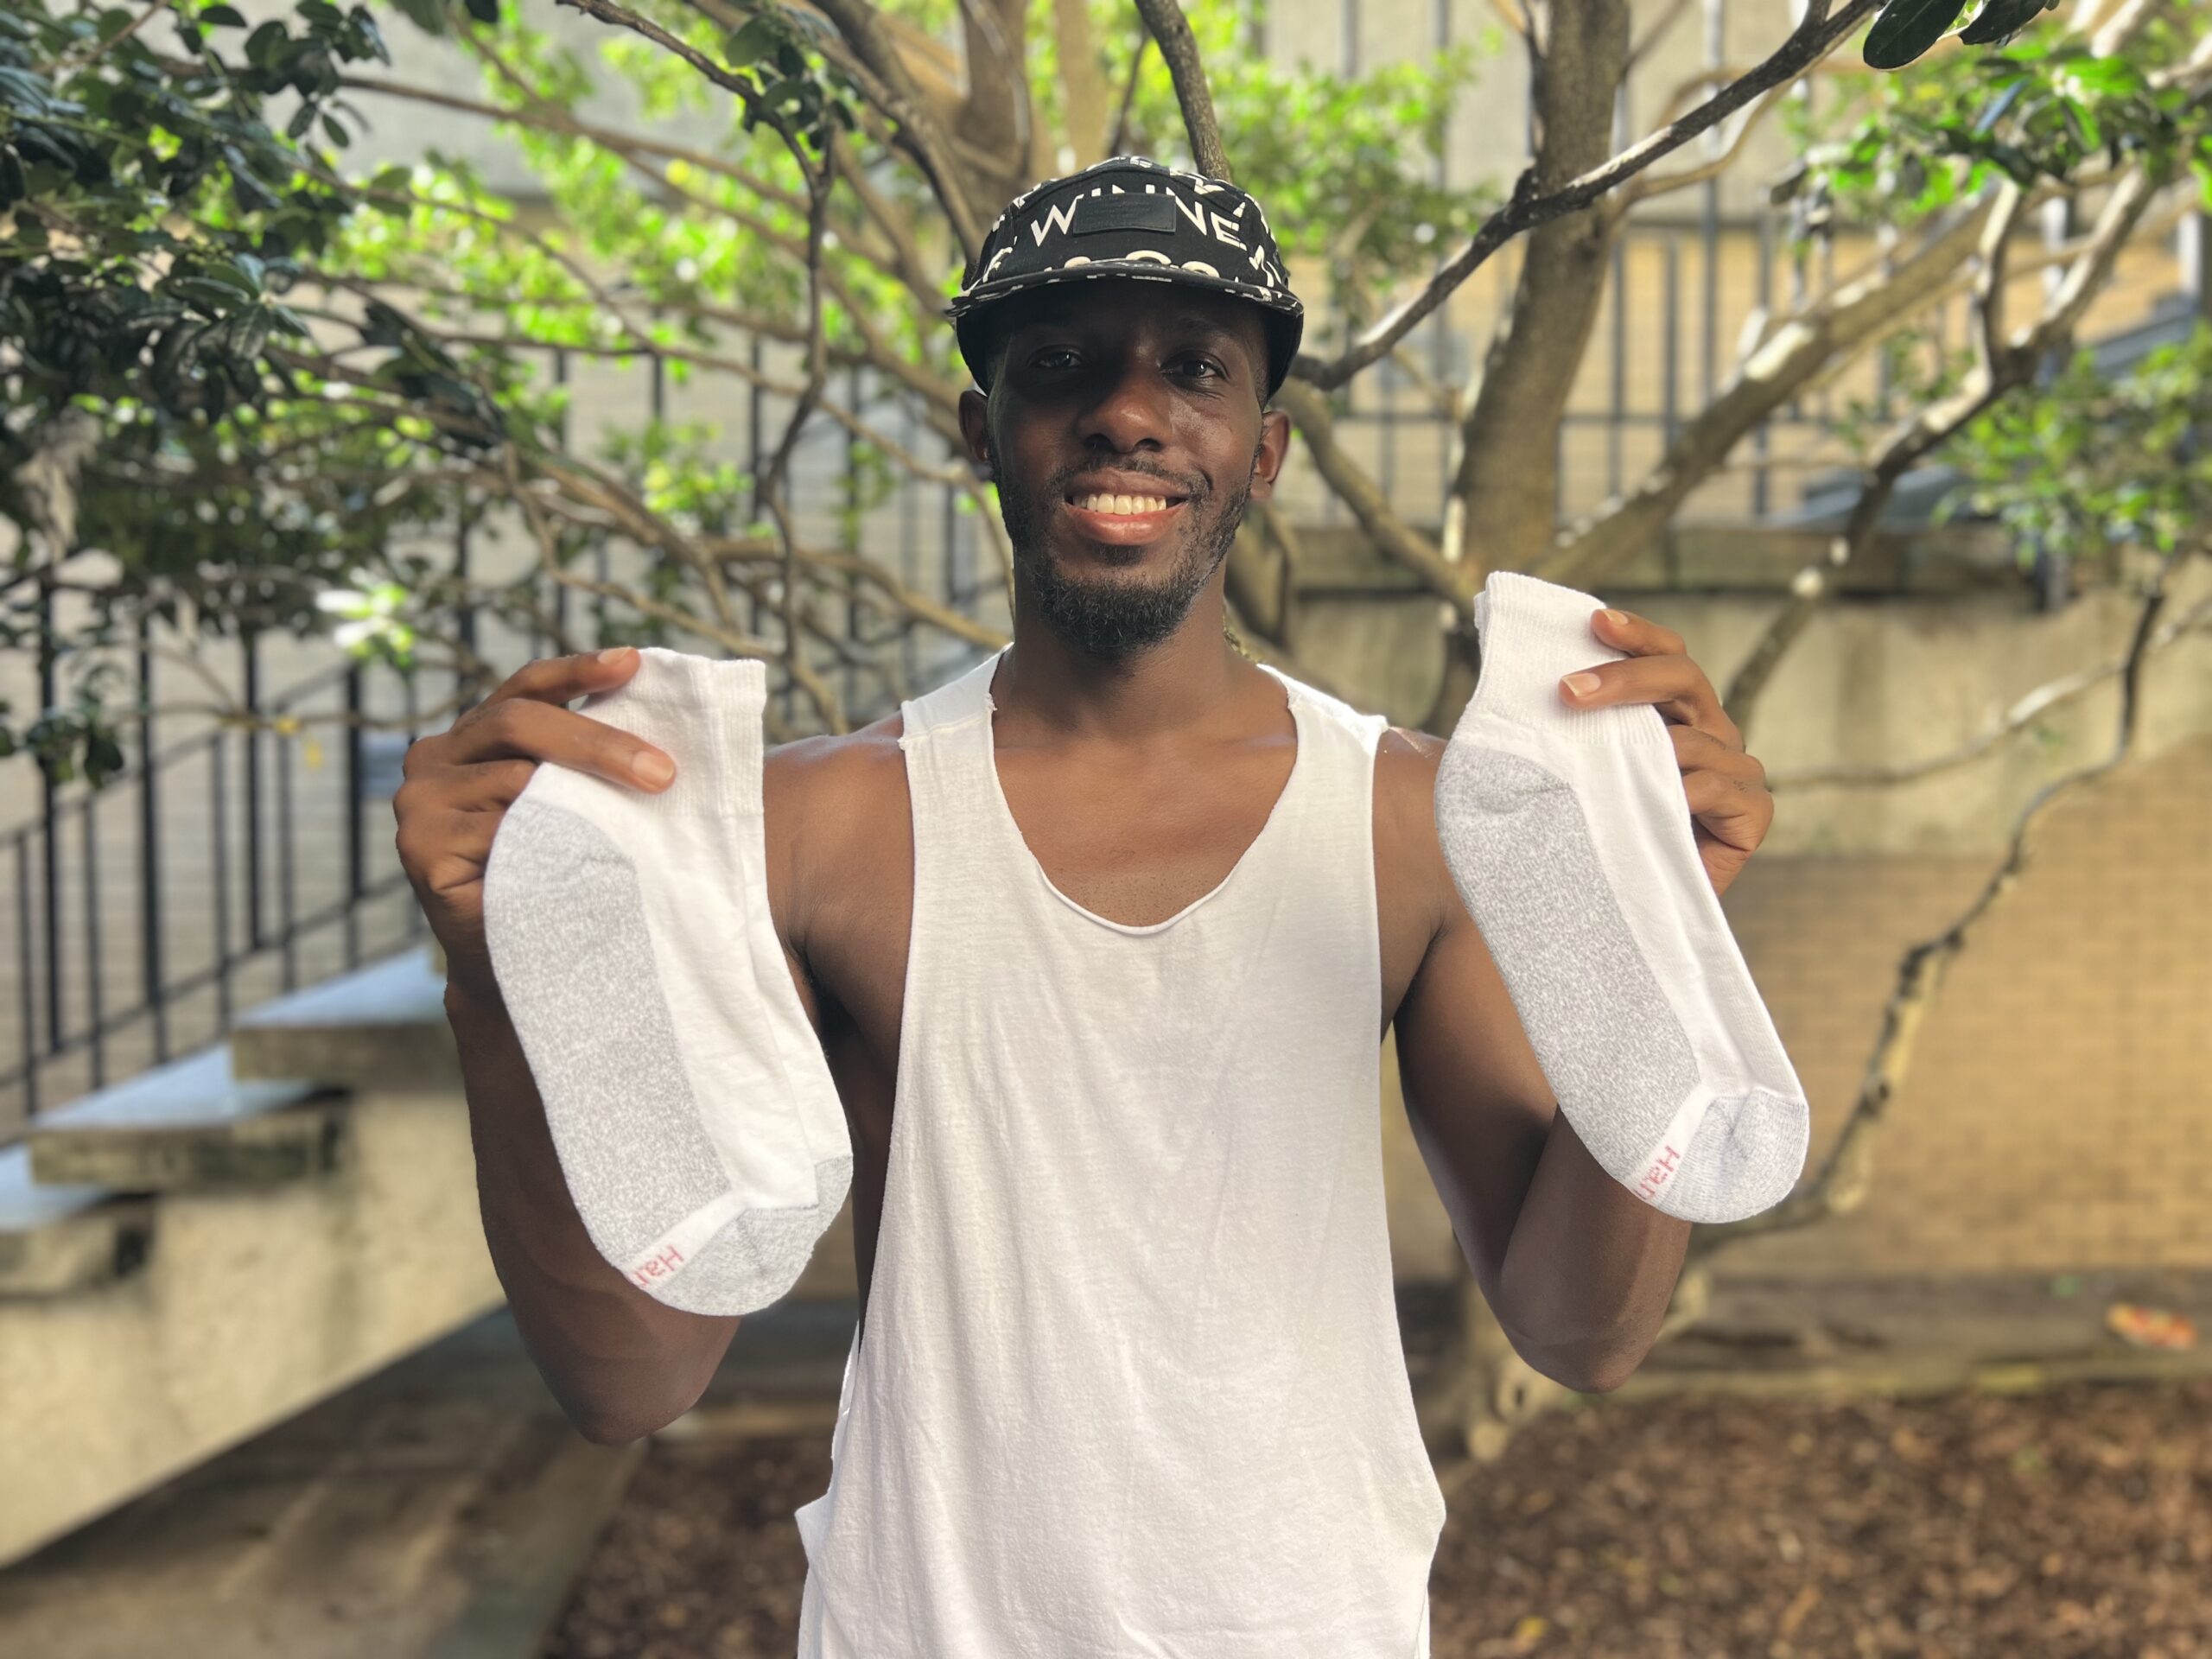
To get to know our guests even better, check out the stories on our blog, or come meet them by volunteering!